Friday 7 December 2012

How BBC Breaking News Track Individual Tweets

In a previous blog I mentioned how it's possible to separately track the activity of numerous tweets that all point to the same page by adding dummy text to the web address e.g., www.analysismarketing.com/#blogtest

This means when you use a tweet shortening service (either directly within Twitter or using a tool such as Bit.ly) each unique address e.g., /#01, /#02 will be given a different shortened link.  Without this, every time you tweet a link to the same page it generates the same shortened link making it difficult to attribute activity to individual Tweets.

A good example of an organisation that puts this in to the practise is the BBC with the @BBCBreaking account.  Depending on how big a story is, there might be several tweets linking to the same article.  An example of this was the arrest of Max Clifford.

@BBCBreaking sent out two tweets, one at 1:11pm and one at 1:19pm on Thursday 6th Dec.  Both were to the same webpage but as there were dummy details added, they have separate short-codes:
Click-Through volumes from the two tweets.  The first is around 40% higher overall but the response curves have similar patterns
The two tweets have different addresses: http://www.bbc.co.uk/news/uk-20627765#TWEET424921 and http://www.bbc.co.uk/news/uk-20627765#TWEET424943 but go to the same physical page (i.e., everything from the # onwards gets ignored).

If you're promoting the same article/page on numerous occasions, this method is a way of tracking the individual piece of activity that has driven that click.  This principle works across wherever you put the weblink (Twitter/Facebook/LinkedIn/Email etc.,) and gives you a lower level of detail than would otherwise be available.


Wednesday 28 November 2012

Twitter and Bookies - Case Study

My interest in numbers probably started from a very early age working out the expected winnings from my Auntie's accumulator or working out the number of possible doubles and trebles from horses picked to be able to calculate stake money.

I didn't realise it at the time, but working out the return from a 50p double on a 6/4 and 15/8 shot was a great intro into probability and ever since I've had a huge interest in betting.  I rarely bet however partly because I know the bookie marks up odds to give a total probability of over 100% so I would expect to lose money in the long run (unless I take the view that I'm better placed to allocate odds than the bookmaking industry, which I'm sure has led to the bankrupting of many an 'expert').

Due to this interest, I've used Bookmakers as my most recent example of organisations using Twitter, I've put together a case study that looks at the Twitter following of a number of major accounts involved in the betting industry.

Some of the main points are:

  • Huge variation in overall followers from some big accounts such as Paddy Power (@paddypower) which is now around 100k followers down to Bet Victor (@betvictorfans) which has only a few thousand.
Twitter follower volumes at time of analysis (9th-11th Nov)
  • Average (median) follower of one (or more) of these accounts follows 165 accounts and is followed themselves by 38.  There is a huge disparity in follower volumes between the Twitter influencers and the average user
  • Over three-quarters of the c268k following one or more of the Twitter accounts we looked at followed only one of the accounts which was surprising.  Where a serious punter might have several accounts to enable them to get the best odds on a market, it's arguable that an average punter might just stick with one.  This is probably reflected in the relatively generous free bet offers that bookies use to tempt new punters.  If you are serious punter there's a big difference between 6/4 and 15/8 but if you're putting your money on markets such as first goalscorer where the bookies margin is far bigger, getting fractionally better odds is far less of an issue.
Of those following 1 or more of the accounts analysed, total number of those accounts followed
  • 'Come for the banter, stay for the odds' seems to be the motto of the more successful Twitter accounts with a number of the ones with bigger followings including jokes, pictures of WAGs in their underwear etc., as a means of getting their account visible beyond their own followers by attracting retweets (and hopefully as a result extra followers).
  • Twitter can be a lot of work for little reward, the sheer volume of tweets means that your message can easily get lost in the mass unless it has something that makes it stand out.  Analysing some of the responses from the bit.ly from some of the accounts often gave click-through values in single digits. 

The full case study is available to download at the Analysis Marketing website.

Thursday 25 October 2012

Why 'everything' is a database


There was a character in the late 90s sketch show ‘Goodness Gracious Me’ who kept annoying his son by claiming that everyone of note came from India:
Da Vinci? Indian. The Queen? Indian. Picasso? Indian.

I have a similar trait to that character except my ubiquitous reference is ‘Database’:
Google? Database. Facebook?  Database. Twitter? Database.

Ultimately all big organisations are doing the same thing, just in slightly different ways: they all collect huge amounts of data with the difference being how they pass that back to users with they key being how they store, manipulate and disseminate.

What’s all this got to do with football?  Well, looking at the MCFC Analytics data I was struck by the similarities between this and the kind of data you might see within a normal customer database, the data is provided at a level of one record per player per match which could be considered to be like items from an order, each order has multiple items and each customer (Team) has multiple orders.

From here the natural step is to turn a load of data into summary views which would provide the starting point of any analysis which in database marketing terms would be:

Single Team View – One record per Team
Single Match View – One record per Match
Single Player View – One record per Player

The insight usually comes not just from aggregating the raw data but from manipulating it to create extra variables which give a greater depth of understanding beyond just totals and averages.

The first one of these I have put together is the single team view, the main part of this is just totalling the details of the individual players (along with the own goals data) but also adding other details added in around each team.

This produces a table of nearly 200 hundred columns, so is fine as a data source but looking at it for any length of time will give you a headache.  The job of any analyst should be to be able to take this and make something more user friendly.

To that end I have produced a summary dataset called single team view summary.xls which is one record for each of the teams which as well as having the usual goals scored/conceded also has some other information which I think is pretty interesting.

Much has been made about Newcastle possibly punching above their weight (i.e., lucky) and possibly in store for a more average season this time.  It’s certainly true that there are a number of stats which suggest they over performed:
  • Newcastle only had more shots than the opposition in 15 of their 38 games around half of the number of teams around them in the table.
The top 4 (plus Chelsea and Liverpool) had more shots than the opposition in the majority of their matches
  • They conceded 2 ‘Big Chances’ for every one ‘Big Chance’ they had (ratio of 0.67 Big Chances created per Big Chance conceded), Chelsea are the only other top half team where the ratio is less than 1.  Where a 'Big Chance' is described as an opportunity where a goal would be expected.
For this metric, the top 4 (plus Everton, Liverpool and Fulham) are the only sides to create more 'Big Chances' than they concede
  • For the majority of their games, Newcastle had fewer passes and fewer final third passes than their opponents where the rest of the top 6 dominated.
The traditional 'Big Six' were the teams that tended to dominate passing (especially final third passes), with Swansea and Stoke being outliers.

Liverpool were arguably the opposite of Newcastle in terms of dominating games but not seeing it returned in points but although luck may play some part in results, the ability to be clinical in front of goal (Newcastle:11.5% of shots were goals) or not (Liverpool: 7%) is not some random event but is arguably something a manager may have little control over on the day itself but does in terms of signings and selection.

Other things of interest were Swansea making more passes than the opposition in 33 of their 38 games, but only more final third passes in 9 games with Stoke being the opposite, having just 3 games where they made more passes but 12 where they made more final third passes.

There are an almost infinite number of ways of reformatting the MCFC Analytics dataset and the output above is only the tip of the iceberg.  Given the amount of data involved it may be that collaboration and sharing of datasets is the fastest way to gain an overall understanding of the data.

The spreadsheet behind the figures above (which contains a number of other derived metrics including home/away splits) is available at: https://skydrive.live.com/redir?resid=A1BA00769DC2D906!105 along with the Own Goals data and other Premier League related output.

Dan Barnett
Director of Analytics


Friday 19 October 2012

Twitter Analysis - Ben Goldacre

Previous posts have focused around the Twitter activity of journalists at The Times promoting their articles.  This blog looks at the activity of someone who appears to have a great understanding of making the most of Twitter.

Ben Goldacre is a doctor who is arguably best known for his bad science articles in the Guardian (and book of the same name), he has over 230k Twitter followers so must be doing something right.

The reason I have picked Ben for this blog is that he is a good example of someone who is willing to repeat his message (but not in a spammy way), a simple example of this is where he tweeted a link to his article around Glaxo SmithKline.

The tweets linking to the same article were sent out at 9:37pm and 10:57pm on the 11th Oct and also 10:36am on the 12th (oldest one displayed first):
The response by hour shows how the third Tweet has almost double the response of the initial tweet (there were sent at almost the same time past the hour so a pretty fair comparison can be made between the two).  It's possible that just after 10:30 on a Friday morning is the perfect time to hit people on a mid-morning break looking for something interesting to read to distract them from work.
  Response by Hour to the link mentioned in the Tweets

There are other tweets in between these so it is not as if Ben is just hammering home a single point with nothing else to say.

Another good thing that Ben does is not assume that anyone reading any single tweet will know the whole context of what he is saying, rather than just linking to something once and then sending follow up tweets talking about that subject, Ben includes the link for reference in each tweet (as seen below, again there will be tweets on other areas between these tweets).

A series of tweets around the same topic (most recent first), there's every chance that a follower could first be reading Ben's tweets on this subject at any point so the link helps to provide context (and drive activity).

If you're only following 10 people on Twitter then obviously this would be quite annoying but generally people are following 100+ accounts and not checking their timeline every 5 minutes so the risk of over-exposure is minimal even if I did see someone sarcastically tweet that they didn't realise Ben has a book out at the moment.

Find out more about how we can help you with data at www.analysismarketing.com

Dan Barnett
Director of Analytics


Thursday 11 October 2012

It's not just what you say, it's how you say it

In previous blogs looking at the activity of The Times dropping the paywall an hour at a time for selected articles, I've looked at the value of resending the same/similar message.  In this example, I look at the fact that it's not just follower volumes that's important it's relevance (and also the message itself).

In a piece on the recent sponsorship deal with Wonga for Newcastle United, George Caulkin rails against the increasingly depressing impact of business on football.  This was sent at 4pm on Tue 9th October with the article being free to view between 4pm and 5pm
This was retweeted by a few other people but as of 4.30pm had only had a few hundred clicks even though George has over 34k followers (not a bad resposnse for a tweet though).

By the end of the hour though, the link had been clicked over 2,600 times.


This was due in part to George promoting the article again with a follow up tweet:
This tweet was then retweeted at 4:42pm by Joey Barton who has 1.7m followers, creating the first of the two large spikes.  Joey had already promoted the article with the direct link (and had some Tweets back and fore with George).

The second spike was due in part a tweet at 4.52pm from Mirror reporter Ollie Holt which both praised the article and also reminded people that there was only a few minutes to go before the article was no longer free.
Despite the fact that Ollie Holt with 154k followers has less than a tenth of the followers of Joey Barton, it would appear that Holt has generated a greater response.

This will be for a number of reasons: the piece is personally endorsed rather than just retweeted (where it will appear as coming from George Caulkin with just details of 'retweeted by Joey Barton' at the bottom) and there is also a direct call to action: 'Read it quickly. Only free until 5pm'.

As mentioned in other posts, the details above are for visits using the Bitly link mentioned in the tweets, there will be cases where people have found it themselves or choose to link directly without the Bitly link so these figures are more the impact of initial tweets not the overall activity to that page.

It can sometime seem like Social Media is a whole new world and all the rules of marketing have changed but that's often not the case.  As can be seen from the impact of the enthusiastic endorsement of Ollie Holt's tweet combined with the time limited call to action a lot of the traditional methods of generating response are still valid.

Dan Barnett

Director of Analytics

Wednesday 10 October 2012

A great example of Twitter usage

I recently followed a restaurant on Twitter who then quickly replied with a Direct Message containing a link to get 50% off a meal there (I've blanked out the name).

This use of social media is even more impressive considering it is a single restaurant rather than a chain but seems to be an organisation that understands the benefit of striking while the iron is hot to have an interaction with a potential customer.

With any kind of offer/promotion the key thing is to be able to monitor its effectiveness, if all of a sudden all your regulars are bringing this in then it's costing you money.  The kind of thing you'd want to be able to track  would look something like the below:


Where the first 4 columns are completed when the person calls to book and the last two when they ask for the bill.  This back end analysis is the difference between just saying 'Loads of people used the vouchers' and knowing how the typical voucher user compares to a typical normal customer.

If for example you are getting a disproportionate number of people coming in and spending little or nothing on drinks then that makes a huge difference to the profitability of the promotion.

Obviously not every company can offer 50% off for everyone who follows them on Twitter but there is something to be said for making some kind of contact to people who follow you.  Depending on the volume of followers this can either be an automated response or have a more tailored personal touch to show you've thought about what part of your offering you think the follower might be interested in.

Dan Barnett

Director of Analytics

Wednesday 12 September 2012

MCFC Analytics - Some thoughts about data


The release by Opta/Manchester City of player data for the 2011/12 season is something that could potentially open up a whole new area of analytics to the wider public which previously would have been restricted to those working at the clubs.

More details are available here but essentially what has been released is a dataset of one record, per player per match for all games of the 2011/12 season with details such as goals scored, passes attempted/made etc.,

This post is more concerned with the data aspect of the project than with the practical application of the data (which will come in later posts and on my Swansea City blog www.wearepremierleague.com).

The raw supplied Excel file contains 10,369 records (excluding column headings) and 210 columns, so even though it’s just a summary of a players activity within a game it’s still a sizeable file.

Most of the initial toying of the data I have done with Excel (in particular pivot tables), but I’m using Access for the more detailed manipulation as often easier to manipulate data in a database rather than a spreadsheet. 

Below are a few details around changes and derivations I have made from the initial file.  Apparently over 5,000 people have requested the file.  This shows a huge level of interest but also means that without a sufficiently quick feedback loop for the data, there will be a lot of people doing the same sort of processing that could have just been done once and also leaves the data open to different interpretations rather than one true set of metrics.
Own Goals
An example of this is that the dataset doesn’t directly contain information on own goals, it would be an easy mistake (as I did initially) to think you could just sum the total of the ‘Goals’ column to get total goals scored by Team.

What the data does have however is the total goals conceded by the Goalkeeper on the pitch at that time so if you know the number of goals the opposition team has conceded in a game and the number of goals ‘your’ team has scored then:

Goals for your team coming from opposition own goals = Total Goals Conceded by Opposition in match – Total Goals Scored by your team

To do this I have created a summary table of one record per team per match from the initial data, with the image below showing some of the fields for the Swansea – Chelsea game where Neil Taylor of Swansea scored an own goal:


Where Total_Goals_exc_own_goals is the sum of the ‘Goals’ field in the raw dataset.

I then created a second table which has details of goals conceded per team:


From these two tables you can see that no Chelsea player scored a goal in this game but that Swansea conceded one.

I then updated a ‘Total Goals Scored’ field in the first table by matching the ‘Team’ in the original table to the ‘Opposition’ in the second table and also the ‘Opposition’ in the first table with the ‘Team’ in the second.  

As a extra measure in case at some point in the future the data has more than one match where Swansea were home to Chelsea I also matched on date.

This then gives the following information:


From this 1 record per team per match summary, you can then create an overall summary of goals scored:


This is interesting as much was made of Liverpool's 'bad luck' in hitting the woodwork so many times last season, but not heard as much about their 'good luck' regarding own goals.

Derived Fields
In addition to the fields supplied by Opta, it’s likely that you’d want a number of extra derived fields added, as mentioned previously it could be beneficial to have a process where there is a latest approved version of the file available for people to use that has a number of agreed extra fields to avoid everyone having to create these themselves.

One example of this would be having a ‘Total Shots’ field as with the raw data there is no total but only the constituent parts (On Target/Off Target/Blocked).  

As with anything of this nature there’s the balance between everyone using consistent definitions/data and the fact that extra fields means bigger file sizes.

Another example of a derived field might be having a standardised name format: If you want to be able to filter by name, it makes more sense to have the name in a single field rather than having forename and surname separately.  It also removes the strange anomaly in the data that ‘Adam Johnson’ is listed in the surname field rather than ‘Adam’ as forename and ‘Johnson’ as Surname.

There are a few cases where a player is genuinely only known by one name (e.g., Alex at Chelsea) so using excel/access we can create a Player Name field by taking Forename and Surname where both supplied or just Surname where only Surname supplied.

This however doesn’t create a unique field to filter on as there was a Paul Robinson at both Bolton and Blackburn last season and also cases where the same player played for multiple clubs; the easiest way around this is to add the players club on to the name when creating the field that will be used for filtering by name.  This gives the option to then filter by person or by person at a specific club.

Also, the raw data contains a player ID which you can use to differentiate between where it’s the same person for two teams or two different players.

Metadata
The raw dataset contains only instances where a player gets on the pitch so needs a bit of rejigging to fill in any potential blanks.

I’ve done this by using the raw data to create a summary table of all matches (grouping the table by Team/Opposition/Venue/Date e.g.


This then gives a list of all the fixtures for all the teams (20 teams playing 38 matches = 760 records).

The next step was to create a deduplicated list of all players for each team e.g., Joshua (Josh) McEachran has an entry for both Chelsea and Swansea.  This gives a list of 561 players, matching this to the fixture table (matching by team) gives a total of 21,318 records (561 players for each of 38 matches).

This gives the ability to create a dataset which includes details of where a player takes no part in a game such as the chart below showing shots by game for Wayne Rooney.  The blanks are where he didn’t play (as opposed to the zero values which are where he had no shots).


All of the above is still just scratching the surface (even before the more detailed release of within game player actions) but hopefully begins to make the point about creating open source (and approved) modified datasets to avoid large scale duplication of work as well as issues around differing definitions.

Update - 14th Sep.

I have now created a spreadsheet in the same format as the original dataset which has 40 records containing own goals data.  If you add this to the original spreadsheet then the 'Goals' and 'Goals Conceded' totals will now tally.

Spreadsheet is available at: https://skydrive.live.com/redir?resid=A1BA00769DC2D906!105

Dan Barnett

Director of Analytics


Wednesday 22 August 2012

Sweating the Assets – Making the most of what you’ve got with Twitter


As mentioned in previous posts, Twitter is a great way to get your message out to a wide audience but its quick moving nature means your message will probably not be seen by the vast majority who follow you.  Using examples from a number of major websites, in this (and subsequent) blogs I’ll show how most have plenty of scope to make more of what they have.

Bitly is one of the most used URL shortening services and one great feature it has is the ability for anyone to be able to track the performance of a link simply by adding a ‘+’ to that link.  You don’t get the full functionality that you would have if it was your Bitly link but there’s more than enough to get a feel for how a link is performing.

As with any business where their product is content based, The Times are trying to make the most of monetising their product.  Where most go for an ad-funded model, the Times have set up a Paywall to make their online content subscriber-only.

Presumably as a means of quantifying the kind of volume of visitors they could reach and/or to show potential readers what they are missing out on (and encourage to subscribe), they have recently started 1 hour ‘freeviews’ of particular content.

An example of this was an article about Joe Cole and Liverpool that was made free to view between 12pm and 1pm on Tue 21st August.  The chart below shows the click figures during this hour for a link to the piece tweeted by journalist who wrote the article - Tony Barrett @tonybarrettimes (92k followers):

Tweets from @tonybarrettimes regarding the article
Clicks by Minute between 12:00-12:59pm
This second post was retweeted at 12:15pm by Phil McNulty @philmcnulty who is the Chief Football Writer for the BBC Sports Website (160k followers) and 12:16pm by Oliver Kay @oliverkaytimes who is the Chief Football Correspondent for The Times (147k followers).

Other people of note such as Rory Smith @rorysmithtimes (56k followers) mention the article via Twitter but put a direct link to the Times website URL (fine for them for their back end analysis using a tool such as Google Analytics but won’t show up on the Bitly chart above).

From the figures above there are a few points worth making:
·  
  • It may not be the most important marketing channel, but Twitter can deliver a sizeable audience within a short space of time
  • The retweets from Tony’s followers (especially from well-followed accounts) is vital to the overall click volume
  • By using the same Bitly link, it’s not possible to separate out the impact of Tony’s two tweets at 10:56am and 12:11pm (the latter is likely to have driven the vast majority but we can’t be sure)
  • There was scope from around 12:30pm onwards for another push of the message from Tony’s feed anyone logging in to Twitter around then would probably have missed any previous mention of the link
  • If you had a number of Times journalist tweeting the link every 5 minutes or so (e.g., 12 journalists tweet the link once each over the hour), would that be classed as good marketing or would it be felt that goes against the organic, free-for-all ‘spirit’ of Twitter.  Nobody likes the feeling they’re being marketed to, even though the truth is you are most of the time


Dan Barnett

Director of Analytics


Wednesday 18 July 2012

Make the most of Tracking


"If you can't measure it, you can't manage it"

This phrase for me is at the heart of everything related to database marketing, to avoid the guesswork around what activity does and doesn't work.

Following on from my previous piece around Twitter, it's good to know which links from your Twitter feed are being clicked on (we'll look at how to track retweets in a future post).

As mentioned previously, you may post a Tweet to x followers but the number who actually see that Tweet will be significantly less. This will depend on when your followers visit Twitter and how inclined they may be to scroll through their timeline, but it's likely that unless they are looking within 10 minutes of you posting your Tweet it won't get seen.

This then suggests that it's a waste of your hard work in producing your article/blog/promotion to only Tweet it once.  There are numerous things that can impact the response you get to a Tweet that you may want to test e.g., 
  • Time of Day/Day of week - There will be peaks in when people are on Twitter e.g., Early Morning/Lunchtime etc., but this also means that there'll be more Tweets in their timeline so you are fighting for their attention.  Also what you are asking the reader to do will impact on likelihood of click-through e.g., is it a quick or an in-depth piece, is it business related (Marketing Advice) or personal (Hotel Breaks).
  • Tone/Content - How much of the final message should you put in the Tweet e.g., does "Great Twitter Tips here" work better than "Our latest blog on how you can use Twitter to improve your marketing"
  • Frequency - How much is too much?  This is likely to depend on the kind of followers you have, consumers will generally follow a few hundred accounts and business a higher number partly to take part in the follow you - follow me ritual to increase follower numbers and therefore appear more important.
With so many variables it's impossible to test everything at once, any learning should be an iterative process, with the aim to continuously refine what you do until you have the style that works best for you (remembering to still occasionally test that this still holds true).


URL shortening procedures such as within Twitter or bit.ly give you a link that can then be used to track visits to your website.  The only problem with these is that the code is unique to that web address rather than that tweet.  e.g., If I wanted to promote http://www.analysismarketing.com/ then every tweet I send with a link to this address will have the same shortened URL.

A way to get around this is to add an extra part to the address which still takes you to the same page e.g., 
http://www.analysismarketing.com/#This_is_a_test_to_show_what_can_be_done The important thing to do is to start the extra part that you are adding with a # (other characters such as ?) as work.

If you name these links with a bit more thought than the one above e.g. http://www.analysismarketing.com/#TW120871801 (for Twitter Link, on 18th July Link number 1) or   http://www.analysismarketing.com/#0001 where you keep track in Excel what each link relates to then you will know the response for every tweet not just every article you have linked to.

Dan Barnett

Director of Analytics


Friday 6 July 2012

A season on Twitter - Tips to improve usage


Anyone looking at the gap in time between this post and my previous blog (back in Sep 2011) may wonder why I’m coming back after such a long time away.

The reason for the gap is that Swansea City gained promotion to the Premier League and my blogging exploits rather than involving marketing and data have been taking place at www.wearepremierleague.com. It is however a bit of a busman’s holiday in that the focus is still very much on the use of data, just in a different context.

As well as the website, I set up an accompanying Twitter account @we_r_pl. This blog details some of the things I’ve learnt over the course of the season using Twitter which hopefully provide a useful guide as to things to bear in mind when using a Twitter account to give added exposure to your business.

A good account name helps, but can always be changed
Twitter now has over 600m users so there’s a fair chance your first choice is already taken. With a little imagination it should be possible however to get close, examples can be adding a relevant suffix e.g., @danbmarketing

A lot of the time, users will be clicking on a link to get to your Twitter account so in that sense it could be anything but bear in mind someone who see’s one of your tweets second hand e.g., via a Retweet. Hopefully the content will encourage them to follow but a relevant name could also convince them to follow.

The other factor is length of name as if someone is replying to you or mentioning your account that is using up some of the 140 characters.

If at some point you want to change the account name e.g., going from a personal name to a company focused account then as long as the new name is available you can transfer your followers over rather than starting over.

Consider your tone of voice carefully
As with any kind of communication (email/Direct Marketing/Websites etc.,) it’s important that it fits within the context of your brand. Most businesses probably wish they had the carefree, relaxed attitude such as that displayed by Innocent but in reality that would be terrible for a lot of them.

This also relates to what to comment on, the easiest way to gauge it is to consider why people are following you. For my Swansea account it’d probably look strange for me to give my thoughts on Quantitative Easing or the new Spice Girls musical.

On the other hand, Twitter is best when it is a two-way conversation not just a place to drop a link to your latest press release and run away, it’s good to let your personality through as well. It’s also one of the hardest things to get your head around when you start; the analogy I use is that it’s like being in a pub where you can hear everyone’s conversations and where (generally) nobody gets annoyed if you butt in halfway through to give your own opinion.

When to Tweet/Direct Message/Email
This links in with the point above, your twitter feed should hopefully inform and/or entertain so a stream of tweets to various people discussing where you are going when you meet up at lunchtime isn’t likely to be of interest to most of your followers (although discussing where to go and opening it out to your followers may fit in well with your style).

Sometimes it’s better to send a Direct Message to that person or even interact outside of Twitter but it’s useful to remember the key to Twitter is that everyone who is following the person tweeting you will ‘see’ the message and some may then choose to follow you.


When someone clicks on your account name from someone's tweet they will see a summary of your account from which they will probably decide whether you are worth following, if the last 3 tweets are along the lines of 'See you later', 'Semi skimmed please' then this may not convince people to follow:


A summary profile has your last 3 tweets as well as your personal description (Bio) as well as details on number of Tweets you've made as well as how many you follow/follow you.  Will there be enough in here for someone to think you are worth following?
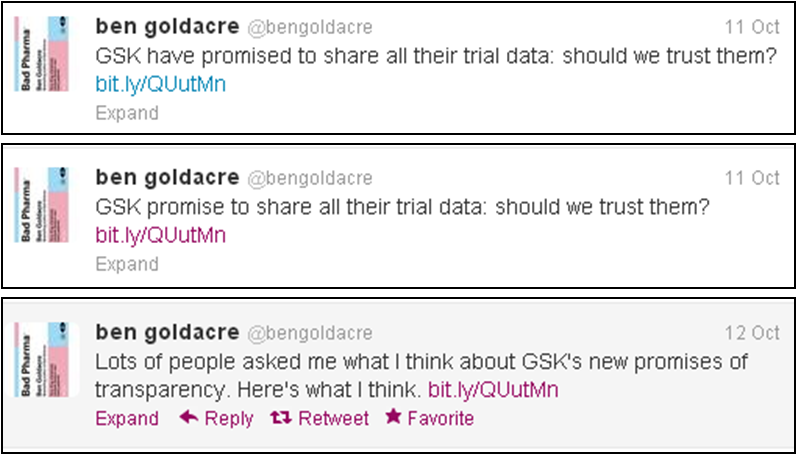
Don’t be afraid to post the same thing more than once
Although that tweet you make appears on the timeline of everyone who follows you, the proportion of people who actually see it will be far less.

It will depend on the number of people they are following but someone following 500+ accounts could easily only view tweets posted in the last few minutes before they have to tap to load extra tweets or scroll through a significant number of tweets to get to those posted earlier.

This means if the person who is ideal for your tweet wasn’t looking at Twitter within that small window of opportunity after you posted the tweet, then the message doesn’t get seen by them.

It may feel like spam to mention your new blog, promotion etc., several times over the course of a couple of days but that would only be the case if they were following just a handful of people.

If you want retweets, be eye-catching
If you want your message to spread it’s important for your tweet to be interesting not just any final content that you may be linking to. 

An example of this is one post I did looking at the Twitter following of Premier League clubs, I noticed that most of them had fewer followers than @anfieldcat (set up by a quick witted individual when a cat appeared on the pitch during a live Liverpool game, quickly reaching 60k followers – and now has over 75k).

My tweets about the blog generally get a few retweets but the one where I mentioned @anfieldcat got retweeted by @anfieldcat and overall retweeted 80 times (excluding any times the tweet would have been edited before retweeting).
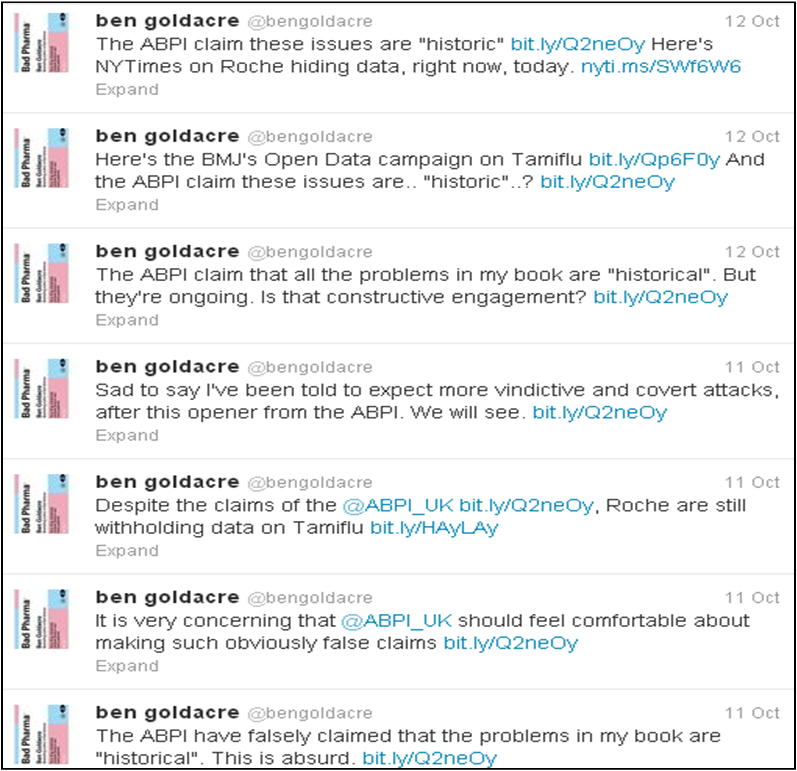
As well as your own content look to others, but credit where it’s due
Any tweets you make should ideally provoke some sort of response, either directly back to you or in the form of others retweeting your content as it’s something they feel worth sharing.

Similarly when you find something of interest and want to share it, you have 3 options:
o   Straight retweet
o   Edited retweet with accreditation e.g., Great link on x here (via @we_r_pl)
o   Edited retweet with no accreditation.g., Great link for x here

For a straight Retweet, you users will see the original tweet as coming from the original source stating that it’s been retweeted by you.

If you edit a tweet and that then gets retweeted, then your name is still linked to the content where if someone straight retweets something you straight retweeted then you are not mentioned.

If you’re editing a tweet before retweeting as long as you’re adding value or context then that’s fine, where you’re just doing it to get the ‘credit’ is a different story and even more so if you don’t even mention where you originally got the information from.

A good example of the different types can be seen from the image below, where the tweet from @anfieldcat has been both straight retweeted and also edited.  There’s also every chance that the joke itself was lifted from elsewhere by @anfieldcat.
An example of a tweet spreading out from its original source 
I haven’t necessarily followed my own advice all the time, the biggest thing I’ve done wrong is avoiding getting involved too much in interacting with other users and the stream has been more like a broadcast than a conversation.

You don’t want to annoy people with constant messages but to go back to the pub analogy, if you just sit in the corner nursing your pint then people will pass you by and you’ll miss out.