
The release by Opta/Manchester City of
player data for the 2011/12 season is something that could potentially open up
a whole new area of analytics to the wider public which previously would have
been restricted to those working at the clubs.
More details are available here but essentially what has been released is a dataset of one record, per player
per match for all games of the 2011/12 season with details such as goals
scored, passes attempted/made etc.,
This post is more concerned with the data
aspect of the project than with the practical application of the data (which will
come in later posts and on my Swansea City blog www.wearepremierleague.com).
The raw supplied Excel file contains 10,369
records (excluding column headings) and 210 columns, so even though it’s just a
summary of a players activity within a game it’s still a sizeable file.
Most of the initial toying of the data I have done with Excel (in particular pivot tables), but I’m using Access for the more
detailed manipulation as often easier to manipulate data in a database rather
than a spreadsheet.
Below are a few details around changes and
derivations I have made from the initial file.
Apparently over 5,000 people have requested the file. This shows a huge level of interest but also
means that without a sufficiently quick feedback loop for the data, there will
be a lot of people doing the same sort of processing that could have just been
done once and also leaves the data open to different interpretations rather
than one true set of metrics.
Own Goals
An example of this is that the dataset
doesn’t directly contain information on own goals, it would be an easy mistake (as
I did initially) to think you could just sum the total of the ‘Goals’ column to
get total goals scored by Team.
What the data does have however is the
total goals conceded by the Goalkeeper on the pitch at that time so if you know
the number of goals the opposition team has conceded in a game and the number
of goals ‘your’ team has scored then:
Goals for your team coming from opposition
own goals = Total Goals Conceded by Opposition in match – Total Goals Scored by
your team
To do this I have created a summary table
of one record per team per match from the initial data, with the image below
showing some of the fields for the Swansea – Chelsea game where Neil Taylor of
Swansea scored an own goal:
Where Total_Goals_exc_own_goals is the sum
of the ‘Goals’ field in the raw dataset.
I then created a second table which has details of
goals conceded per team:
From these two tables you can see that no Chelsea
player scored a goal in this game but that Swansea conceded one.
I then updated a ‘Total Goals Scored’ field
in the first table by matching the ‘Team’ in the original table to the ‘Opposition’
in the second table and also the ‘Opposition’ in the first table with the ‘Team’
in the second.
As a extra measure in
case at some point in the future the data has more than one match where Swansea
were home to Chelsea I also matched on date.
This then gives the following information:

From this 1 record per team per match
summary, you can then create an overall summary of goals scored:

This is interesting as much was made of Liverpool's 'bad luck' in hitting the woodwork so many times last season, but not heard as much about their 'good luck' regarding own goals.
Derived Fields
In addition to the fields supplied by Opta,
it’s likely that you’d want a number of extra derived fields added, as mentioned
previously it could be beneficial to have a process where there is a latest
approved version of the file available for people to use that has a number of agreed
extra fields to avoid everyone having to create these themselves.
One example of this would be having a ‘Total
Shots’ field as with the raw data there is no total but only the constituent
parts (On Target/Off Target/Blocked).
As
with anything of this nature there’s the balance between everyone using consistent
definitions/data and the fact that extra fields means bigger file sizes.
Another example of a derived field might be
having a standardised name format: If you want to be able to filter by name, it
makes more sense to have the name in a single field rather than having forename
and surname separately. It also removes
the strange anomaly in the data that ‘Adam Johnson’ is listed in the surname
field rather than ‘Adam’ as forename and ‘Johnson’ as Surname.
There are a few cases where a player is
genuinely only known by one name (e.g., Alex at Chelsea) so using excel/access
we can create a Player Name field by taking Forename and Surname where both
supplied or just Surname where only Surname supplied.
This however doesn’t create a unique field
to filter on as there was a Paul Robinson at both Bolton and Blackburn last season
and also cases where the same player played for multiple clubs; the easiest way
around this is to add the players club on to the name when creating the field
that will be used for filtering by name.
This gives the option to then filter by person or by person at a
specific club.
Also, the raw data contains a player ID
which you can use to differentiate between where it’s the same person for two
teams or two different players.
Metadata
The raw dataset contains only instances
where a player gets on the pitch so needs a bit of rejigging to fill in any
potential blanks.
I’ve done this by using the raw data to
create a summary table of all matches (grouping the table by Team/Opposition/Venue/Date
e.g.
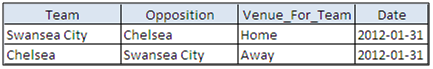
This then gives a list of all the fixtures for
all the teams (20 teams playing 38 matches = 760 records).
The next step was to create a deduplicated list
of all players for each team e.g., Joshua (Josh) McEachran has an entry for
both Chelsea and Swansea. This gives a
list of 561 players, matching this to the fixture table (matching by team)
gives a total of 21,318 records (561 players for each of 38 matches).
This gives the ability to create a dataset which
includes details of where a player takes no part in a game such as the chart
below showing shots by game for Wayne Rooney.
The blanks are where he didn’t play (as opposed to the zero values which
are where he had no shots).

All of the above is still just scratching
the surface (even before the more detailed release of within game player
actions) but hopefully begins to make the point about creating open source (and
approved) modified datasets to avoid large scale duplication of work as well as
issues around differing definitions.
Update - 14th Sep.
I have now created a spreadsheet in the same format as the original dataset which has 40 records containing own goals data. If you add this to the original spreadsheet then the 'Goals' and 'Goals Conceded' totals will now tally.
Spreadsheet is available at: https://skydrive.live.com/redir?resid=A1BA00769DC2D906!105
Dan Barnett
Director of Analytics
Website: http://www.analysismarketing.com/
LinkedIn: http://www.linkedin.com/in/danjbarnett
Twitter: http://twitter.com/analysismktg